Question 2: How does science help to understand biodiversity?
In the last part of Resource 3 Dr Steve Morton explains why he is optimistic about the future and how science can help understand biodiversity, and therefore inform decision makers about what we need to do to protect biodiversity.
Activity
A common technique for estimating the total number of species in an area or habitat is to count the number of species in successive samples within that area. When a point is reached at which additional samples do not yield additional species it is assumed that all, or almost all, of the species have been counted.
You will need:
- A quadrat – a square made with four equal lengths of stick (e.g. garden cane). Useful for calculations if you want to do them later to make the square either 1 metre x 1 metre or 0.5m x 0.5m.
- A magnifying glass will help if you are counting very small things.
How big does a quadrat need to be?
You could do this as a discussion exercise with students – the principle is that you need to be able to capture ‘enough’ data to be meaningful without going to extreme lengths of time, so it very much depends on your chosen habitat and the target species.
If you want to sample plants, how big are they? If you are sampling trees your quadrat will need to be large, possibly 20 metres x 20 metres in older forest. But if you are sampling a lawn for wild-flowers you may get away with a quadrat as small as 25 cm x 25cm (0.25m x 0.25m).
The same is true for animals but these are a bit more tricky because they move! For invertebrates living in leaf litter on the woodland floor 0.25m x 0.25m might work, but large mobile or flying creatures need a different sampling strategy. Have you ever tried sticking a quadrat on a herd of elephants?!
Time:
About 2 hours
Method:
- Select your ‘study area’. This could be your garden, a hedgerow along a publicly accessible footpath or quiet road (beware cars) or a publicly accessible woodland. You need an area at least 10 metres long by 2 metres wide.
- Place your quadrat at one end of your study area and count all the species in it. You can count everything – mosses, lichens, ferns, flowering plants, insects, spiders, other invertebrates, amphibians, reptiles etc. but this can take a long time. Sometimes ecologists just focus on a single ‘group’ of plants or animals and this will still give fairly accurate results.
- As you gather your data create a data table like the example below to record your results:
| Quadrat number | Number of new species | Total number of species |
|---|---|---|
| 1 | 8 | 8 |
So, in this example in our first quadrat we found 8 species.
- Now flip your quadrat on its side, along your 10 metre area sample line, making sure you don’t have any of quadrat 1 species in. Repeat, filling in the next row of the data table:
Quadrat number Number of new species Total number of species 1 8 8 2 4 12 So in our second quadrat we found 4 new, different species to the first 8 we found in quadrat 1. We record the ‘cumulative total’ as 12.
- Continue to flip the quadrat and count new species until you are finding no new species. Your finished table might look like this:
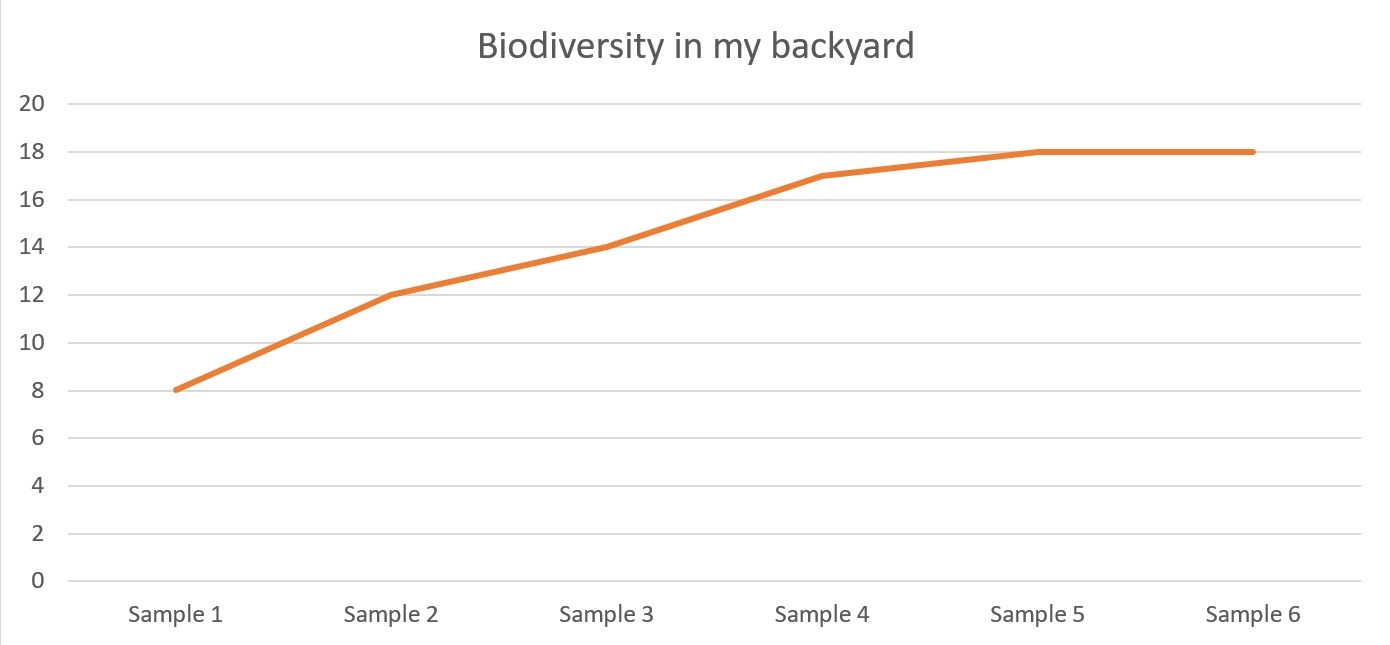
Quadrat number Number of new species Total number of species 1 8 8 2 4 12 3 2 14 4 3 17 5 1 18 6 0 18 - Plot you results on a graph with the quadrat number on the horizontal axis and the total 'cumulative' number of species on the vertical axis. With our example the graph would look like this:
- Now repeat the experiment in a very different area or habitat. How do the two habitats or areas compare? Which has most biodiversity?
- Follow up: An important part of science is to review results and suggest improvements to experimental design especially looking for possible sources of error, so:
- How accurate do you think your estimate is?
- How could you make it even more accurate?
- Where are there sources of error in this investigation?
- If you were counting plants – were they really all separate or could some of them have been the same individuals?
- If you were counting invertebrates – could you be sure that you found them all?
- Finally: Total species counts give an indication of biodiversity but as we heard in the videos there are other components of biodiversity which are not measured in this fieldwork. Remind students that biodiversity isn’t just species numbers. Further – actual diversity indices in biology use species abundance as a measure, that is how much does each species contribute to overall diversity.